
Report
Income inequality in Italy: policy analysis
Occasional paper of the Global Political Economy and Development Department, July 2021. The paper is also available as a PDF.
Executive summary
Income inequality in Italy has increased since the mid-1980s, and the country is comparatively among the most unequal ones in the OECD group. The most salient elements are rising top incomes, a squeezing middle class, and high disposable income inequality.
Three factors concur in causing income inequality. The rise in top incomes and squeezing middle class is rooted in routine-biased technical change and substantially weakened employment protection legislation. The compositional prevalence of pensions in the Italian transfer scheme instead explains the high level of disposable income inequality despite high public social expenditure.
Two consequences. First, a decades-long low-growth path due to slowing consumer expenditure and suboptimal investment in the presence of credit market imperfections, while a positive effect of income inequality on growth through increased saving rates is not observed after the mid-1990s. Second, declining rates of political participation.
Several policy options. Re-regulating employment is discouraged on the grounds of adverse efficiency effects and the institutional barrier of tripartite concertation. Instead, jointly improving flexicurity and increasing spending on primary and secondary education may help contain earnings polarisation and support the middle class in the longer term. To make these policies financially sustainable, and to jointly abate the level of disposable income inequality, it is necessary to reduce pension expenditure and increase top tax rates. Yet, there may be a fundamental trade-off between achieving a sustainable reduction in income inequality and political support.
1. Introduction
The post-1980s period is marked by the increase in income inequality across OECD nations (Piketty and Saez, 2014; Brandolini and Smeeding, 2006).
The evolution of income inequality in Italy also followed such trajectory since the mid-1980s, reversing a previous trend of falling income dispersion throughout the 1970s (Brandolini, 2009). Employing different metrics, the following stylised facts can be isolated to break down the above trend and motivate the analysis.
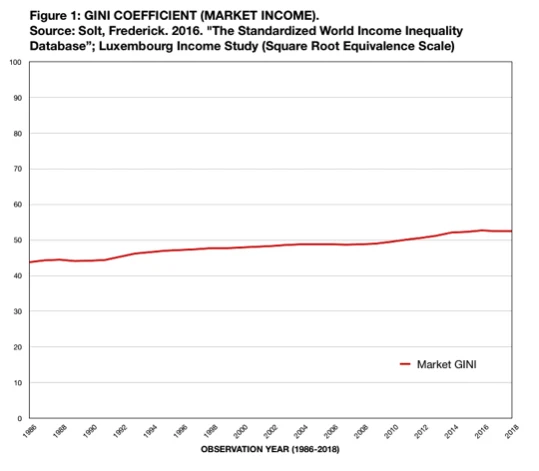
- Market income inequality increased steadily, especially at the middle of the distribution (figure 1; Brandolini, 2009; Vecchi, 2011).
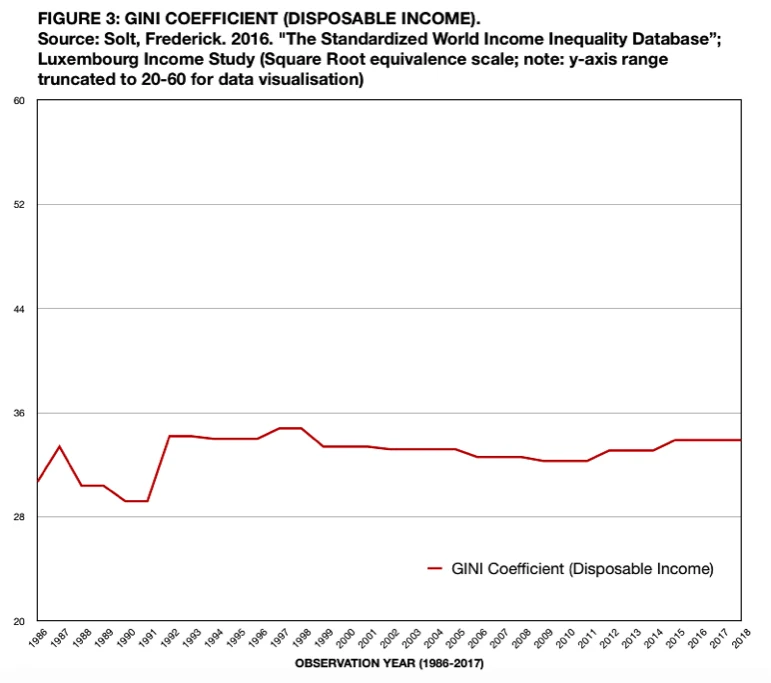
- Disposable income inequality increased throughout the 1990s and remained stationary since then (Figure 3; Alvaredo and Pisano, 2010).
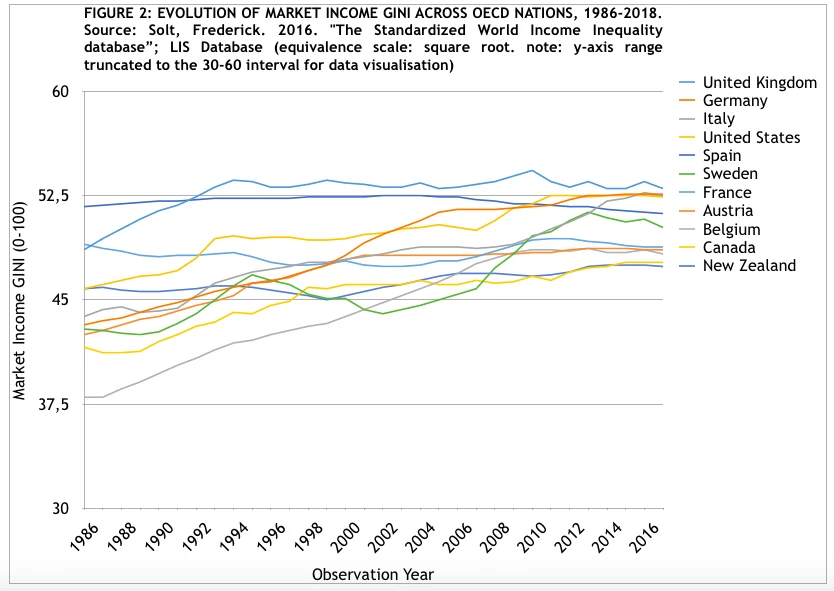
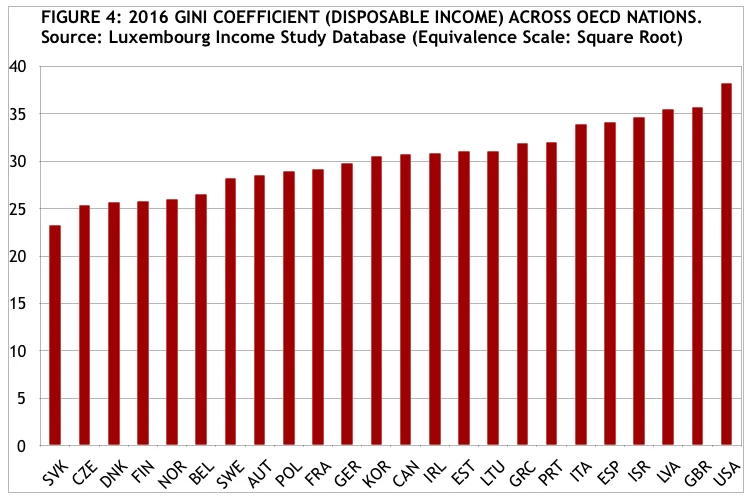
- Comparatively, end levels of market and disposable income inequality are among the highest in the OECD group (Figures 3,4; Brandolini, 2009).
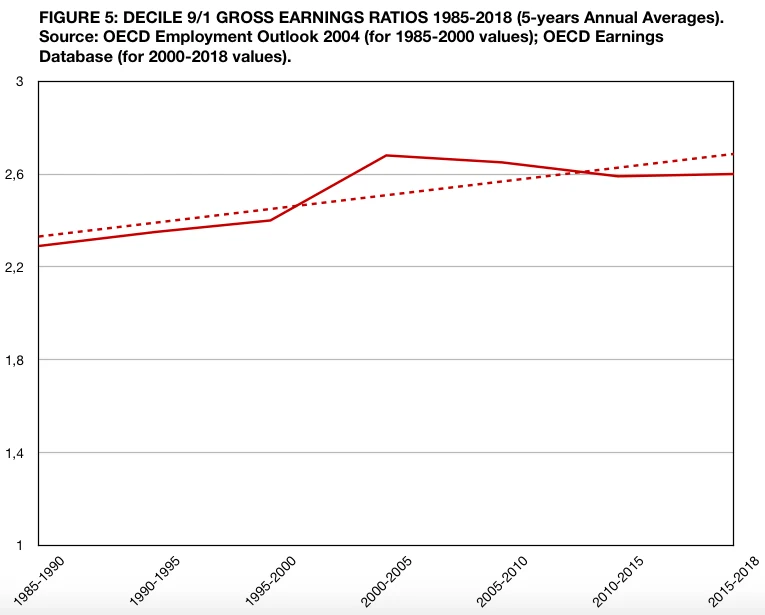
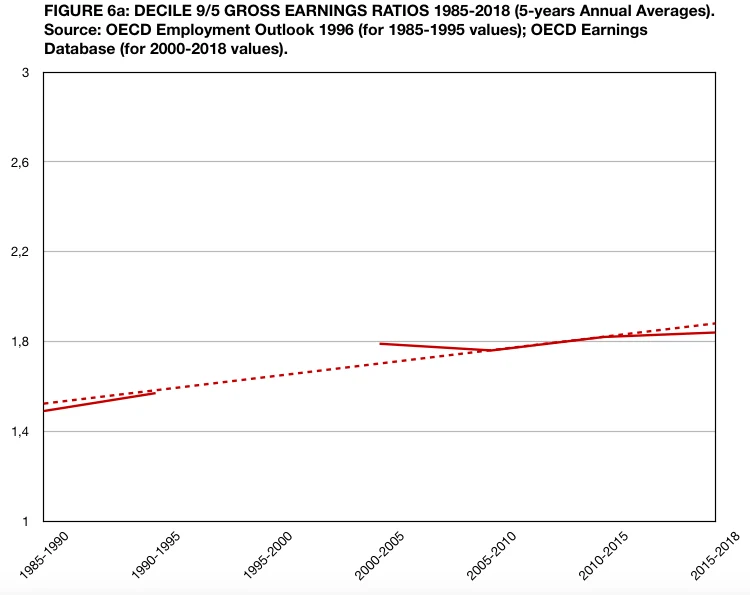
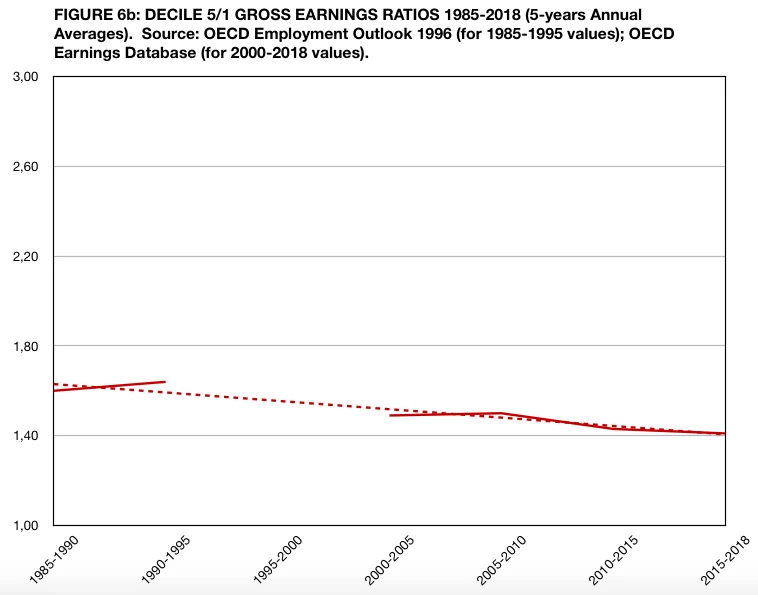
- Gross earnings dispersion increased in the top half of the income distribution and decreased in the bottom half (figures 5, 6a, 6b; cf. Acemoglu, 2003).
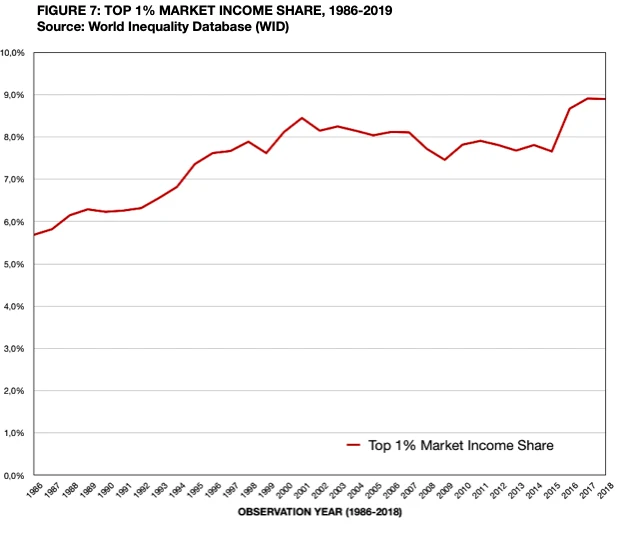
- The top 1% market income share also increased (figure 8; Piketty and Saez, 2014; Alvaredo and Pisano, 2010).
- Facts 1, 4 and 5 indicate that rising income inequality is due in particular to rising top income and a squeezing middle class (Basso, 2019; OECD, 2019; cf. Lakner and Milanovic, 2016).
The policy analysis is organised as follows. Section 2 examines the causes of income inequality in Italy as characterised by facts 1-6. Section 3 examines its political and economic consequences. Finally, Section 4 and 5 respectively assess possible remedial policies and make policy recommendations.
2. Causes
2.1 Routine-Biased Technological Change (RBTC)
The key idea of RBTC theory is that technological innovation substitutes labour in tasks involving routine activities replicable by machines but not in tasks involving non-routine activities (Van Reenen, 2011; Goos and Manning, 2007; Nordhaus, 2007). Further, it may be complementary in production to high skill non-routine activities, as in ICT-intensive sectors (Hope and Martelli, 2019). Technological change thus affects the relative demand for labour across the distribution of wages and skills non-linearly, depressing the relative demand for labour and wages at the ‘routinisable’ middle of the distribution while increasing them at the tails – with a possible complementarity effect for top end incomes (Autor et al., 2006; Autor and Dorn, 2013).
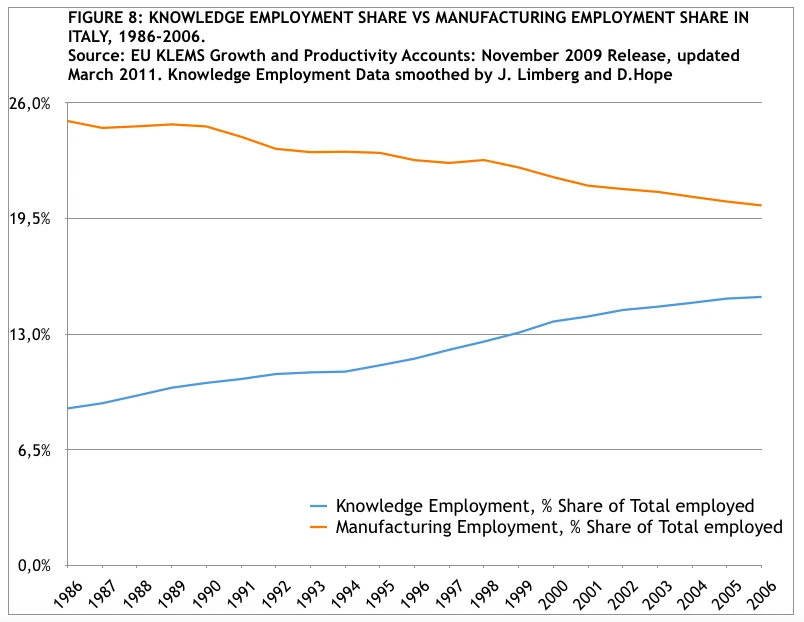
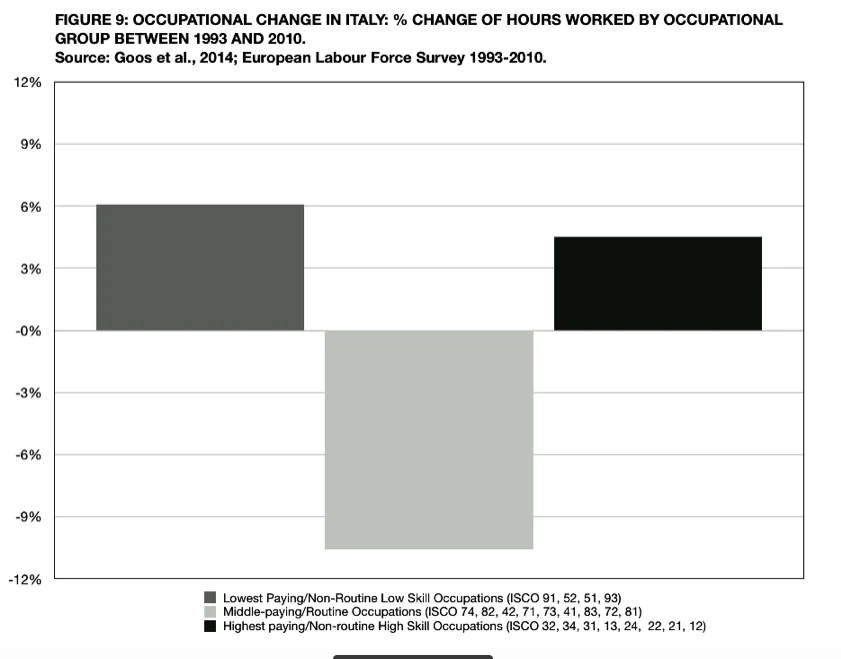
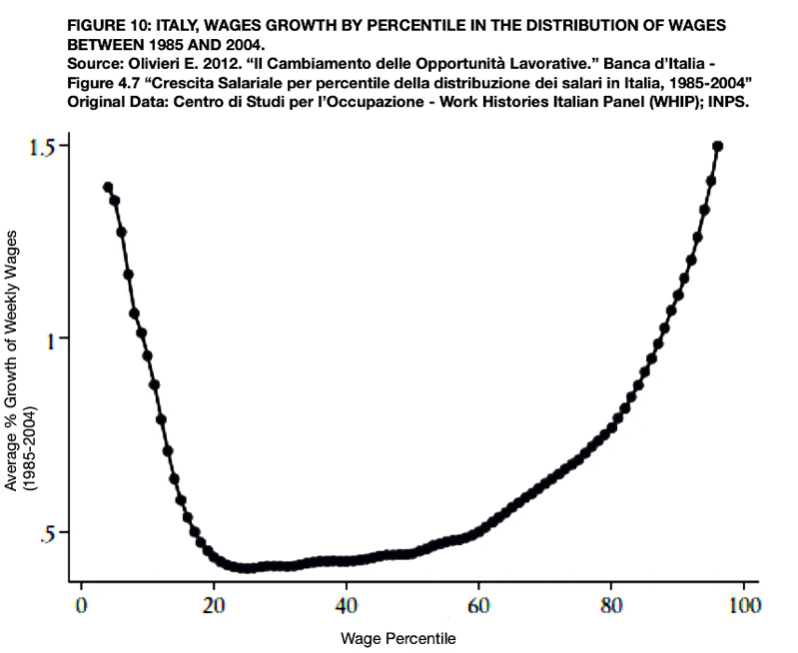
Occupational and wage changes in Italy since the mid 1980s provide evidence of such polarisation in employment and wages in the context of the ICT revolution (Olivieri, 2012; cf. Figure 8). A polarisation pattern subsists both relative to employment opportunities and wages (figures 9-10). Between 1993 and 2010, real worked hours increased for high-skill (4.5%) and low-skill (6%) non-routine occupations and decreased ( 10.6%) for routine occupations for middle-paying routine occupations (Goos et al., 2014). Similarly, between 1985 and 2004 wage growth u-shaped, with middle-paying routine occupations increasing their wages substantially less than low and high paying non-routine ones (Basso 2019; Oliveri, 2012). Such changes are consistent with rising top incomes and rising top half gross earnings dispersion, as well as with a recessing middle class over the same period (Van Reenen, 2011; Guarascio and Sacchi, 2017). Cognately, the documented u-shaped dynamics in the Italian wage and occupational distributions provide evidence against the case for SBTC’s monotonic upgrading of wages as a driver of domestic income inequality.
2.2 The Deregulation of Fixed-Term Employment
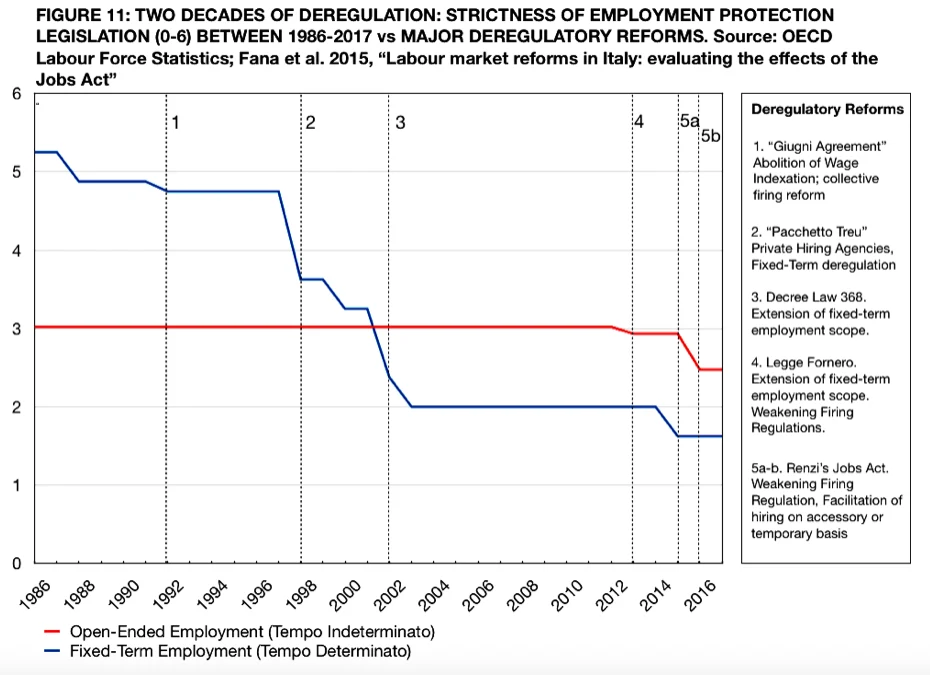
RBTC-induced demand-side changes in the Italian labour market are plausibly complemented by the substantial changes in the LMIs framing labour demand and supply interactions over the same period and in the 2010s (Brandolini et al, 2018; Brandolini, 2009). Although LMIs affect the market distribution of wages via multiple de-commodifying mechanisms (Hope and Martelli, 2019), a general implication of stronger LMIs is strengthening the position of low and middle-skill workers in wage bargaining and thus compressing wage dispersion (Koeniger et al., 2007). In the Italian case, there is significant consensus on the gradual deregulation of fixed-term employment in 1990-2002 and 2010s as the most significant negative change in LMIs, significantly reducing protection for fixed term workers (Sacchi and Vesan, 2015; Ballarino et al., 2014; Boeri, 2011; Brandolini, 2009; Jappelli and Pistaferri, 2009; cf. Baccaro and Howell, 2011).
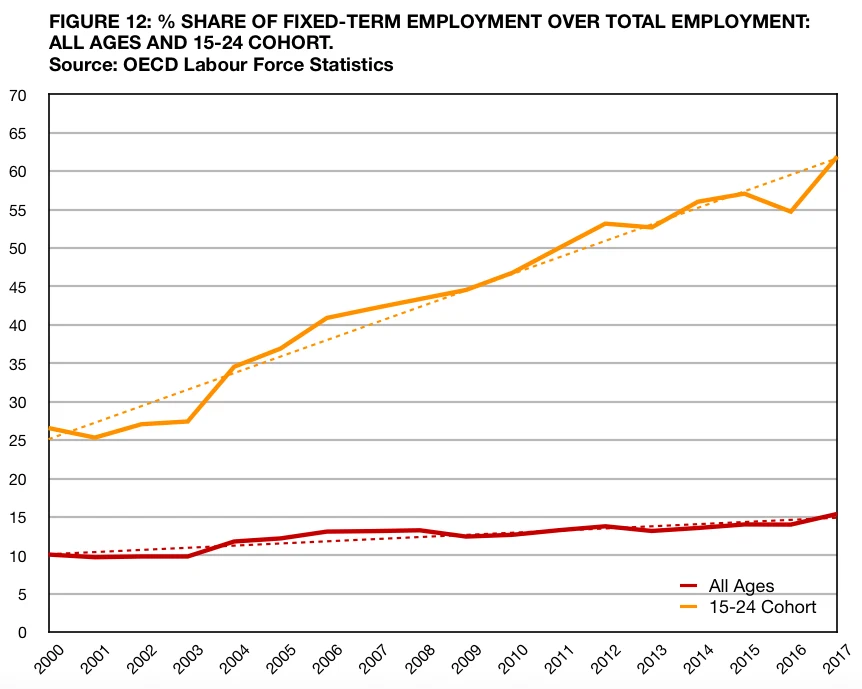
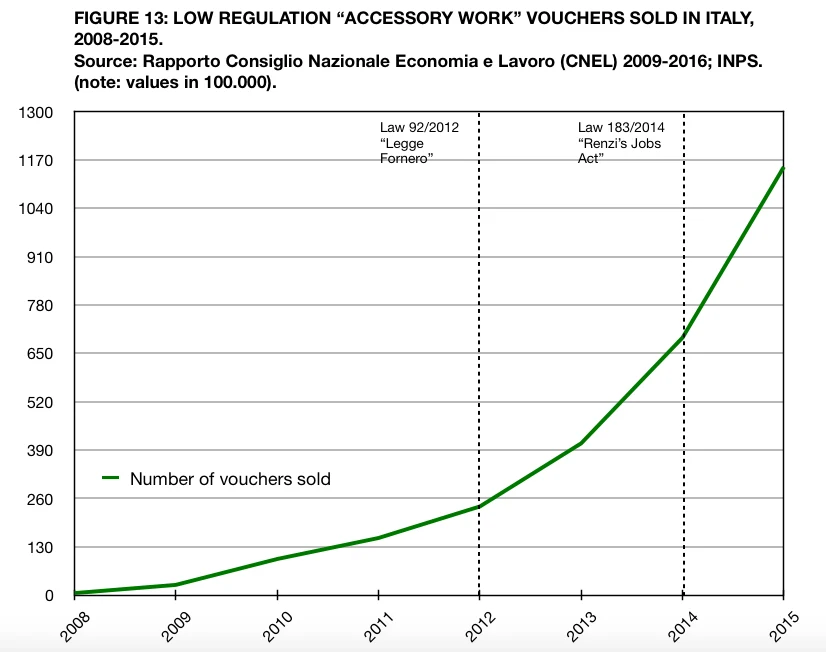
Major changes rolled out by the 1991-2002 trilogy of reforms (“Giugni Agreement”, “Pacchetto Treu”, and DL 368/2002) included the abolition of the previous wage indexation system and relaxing hiring and firing regulations to facilitate the use of fixed-term contracts (Fana et al., 2015; Lasinio and Vallanti, 2013). Similar remarks apply to the recent and contested labour market reforms under the Monti’s austerity programme (2012 Legge Fornero) and Renzi’s centre-left government (2014/15 “Jobs Act”) (Picot and Tassinari, 2017; Armingeon and Baccaro, 2012). As figure 11 shows, the 1986- 2017 period was therefore marked by a sharp drop in employment protection for workers on fixed-term contracts. In turn, the increasing labour market dualism in terms of employment protection (with a watershed point in 2002) substantially incentivised hiring and renovating contracts on a fixed-term basis or via low regulation ‘voucher-based’ occasional work schemes – as respectively shown in figures 12 and 13 (Fana et al. 2015; Brandolini, 2009). The greatest incidence of deregulation-induced declining protection has been among young and new entry workers in middle-paying occupations, whereby occasional work and fixed-term re-hiring may indeed represent an occupational and wage trap (Fana et al., 2015; CNEL, 2016- 2009; Anastasia, 2012). Hence, there is evidence that deregulation of fixed term employment in the 1991-2002 and in the 2010s not only substantially weakened fixed-term workers’ bargaining position in wage setting, but also increased the share of workers affected by such weakening.
2.3 Low Progressivity of the Italian Transfer System
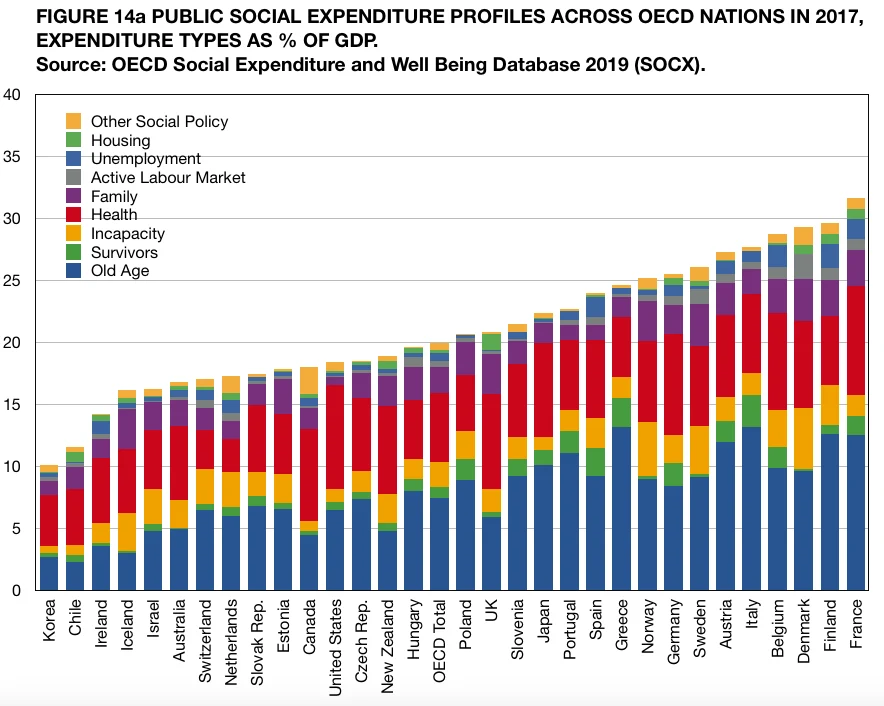
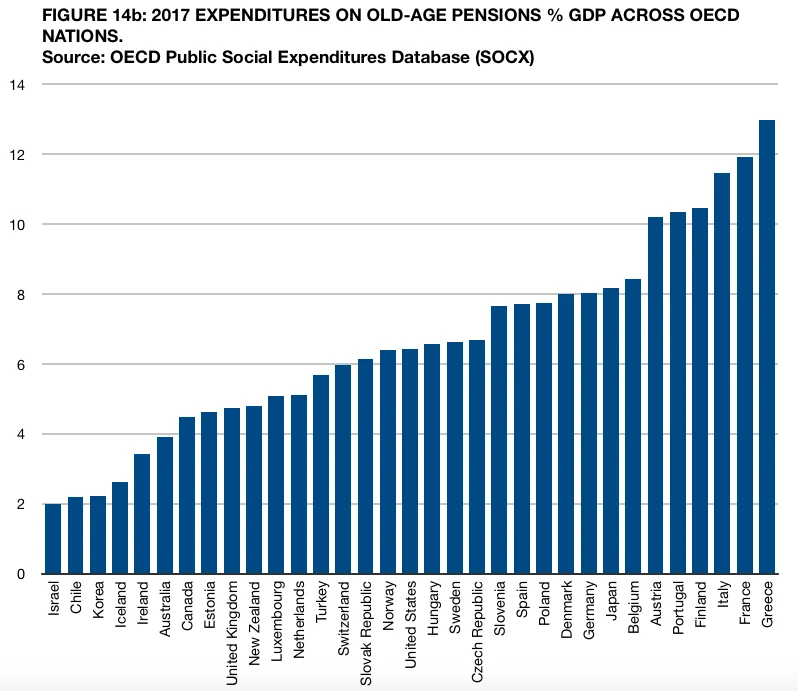
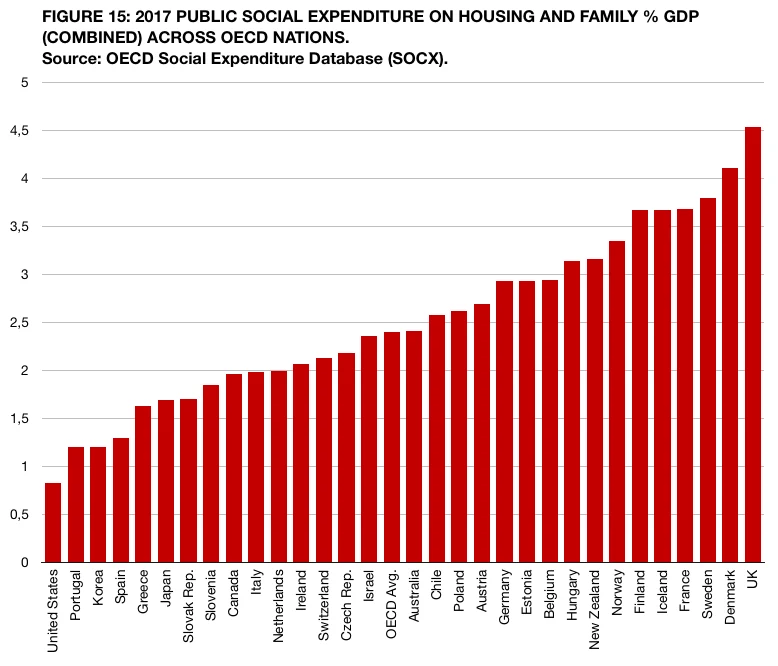
Finally, accounting for the comparative high level of disposable income inequality requires turning to the redistributive inefficiencies in the Italian transfer system (Kazepov, 2015; Ballarino et al., 2014). Evidence indicates that considerable variation subsists relative to redistributive efficacy of different types of transfers. Specifically, progressivity tends to be low for ‘actuarial’ and intertemporal transfers in the form of pensions typical of Bismarckian welfare states (Ibid.). As figure 14a shows, 2017 public expenditure on old-age pensions and cash benefits (13.2% of GDP) accounts for 44.7% of aggregate public social expenditure (27% of GDP). Further, the level of spending on old age pensions is among the highest across advanced democracies (figure 14b). The 2012 Fornero Reform of the pension system tackled this problem only marginally (shifting up retirement age) but leaves unaddressed the fact that Italian old age pensions remain generally tied to lifelong earnings and, as a consequence of their compositional incidence in social expenditure, that a high portion of the Italian transfer system does as well (Sacchi, 2018; Brandolini, 2009). The sclerotic prevalence of low-progressivity expenditures in the Italian transfer system and the comparatively low levels of expenditures on progressive benefits such as housing or family targeted transfers (figure 15), then makes the transfer system little effective in achieving progressive redistribution (Ballarino et al., 2014; Brandolini et al., 2018; Joumard et al., 2012; Franco, 2002).
3. Economic and Political Consequences
3.1 A Low-Growth Path
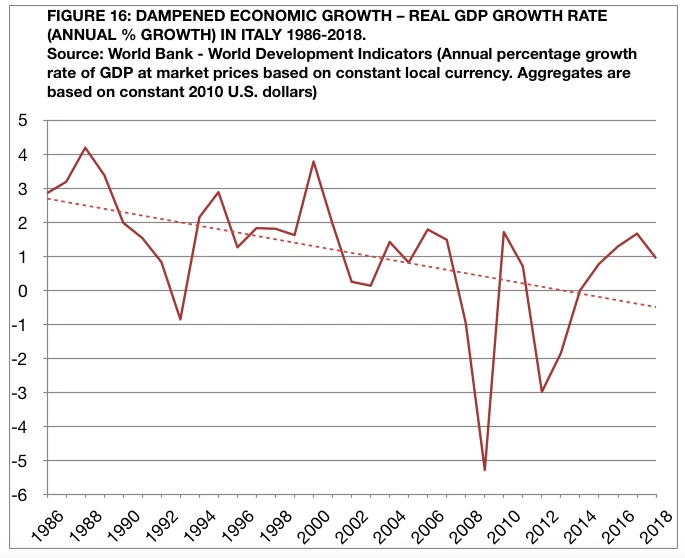
As figure 16 shows, the 1986-2018 period of rising income inequality also registers an overall drop in the economy’s annual growth rate from 2.9% in 1986 to 0.9% in 2018: since the mid-1990s.
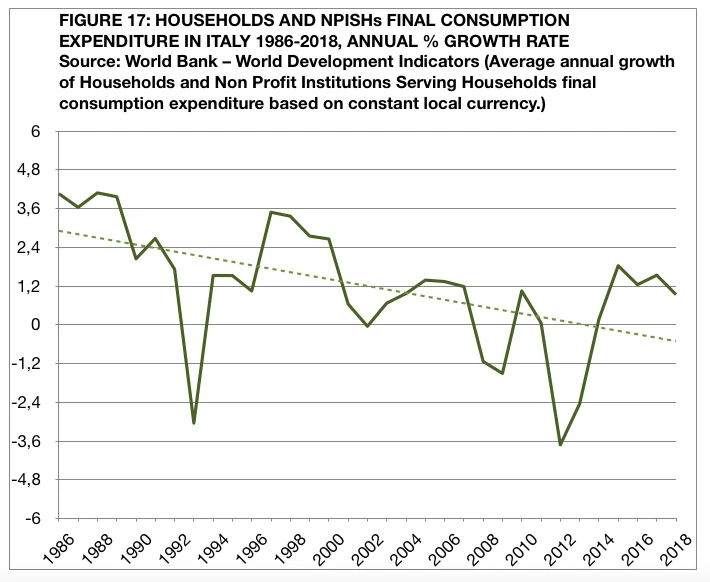
Since there are multiple channels through which income inequality can be expected to harm or foster growth, it is important to disaggregate the above correlation between income inequality and dampened growth in 1986-2018 Italy through multiple such channels and metrics of inequality (Voitchovski, 2005; Cingano, 2014; Andrews et al., 2011; cf. Banerjee and Duflo, 2003). Several sub-effects must be therefore assessed. First, since middle-income households have a higher marginal propensity to consume compared to high-income ones, unequalisation in the middle of the income distribution and the squeezing Italian middle class observed between 1986 and 2018 might have hindered GDP growth by hindering consumption expenditure (OECD, 2019; Iyke and Ho, 2017; Boeri, 2011). Evidence supports this scenario: as figure 17 shows, the annual growth in private consumption expenditure indeed substantially slowed down throughout the 1986-2018 period, pulling down aggregate demand.
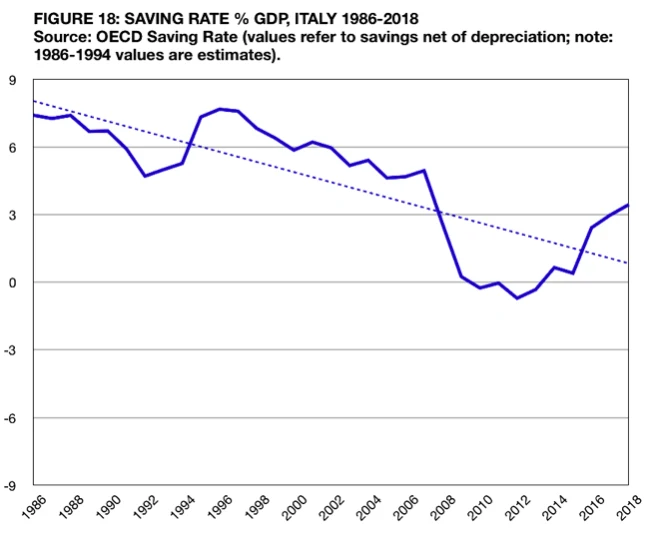
According to literature, the above effect may be in principle be compensated through rising savings due to rising top-end incomes over the same period (Campiglio, 2013; Andrews et al., 2011). This would favour capital accumulation and boost investment especially where the starting costs of economic activities are high (Cingano, 2014; Galor and Tsiddon, 1996; Borguignon, 1981). As figure 18 shows though, Italian saving rates conformed to this expectation only in response to the early-to-mid 1990s increase in income inequality, but followed an overall downward trend since then. Thus, there is no evidence that top end inequality boosted economic growth through saving rates after the mid-1990s.
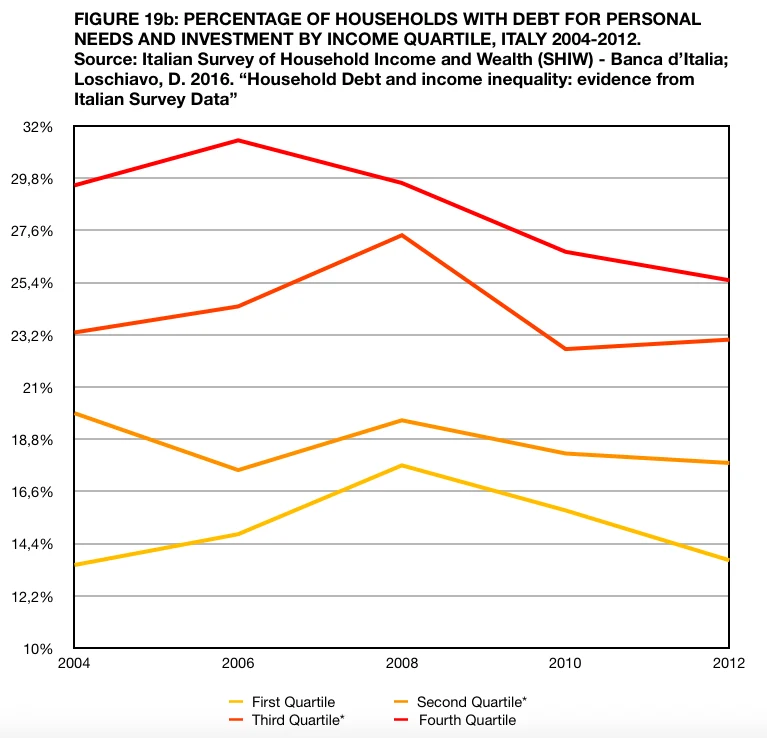
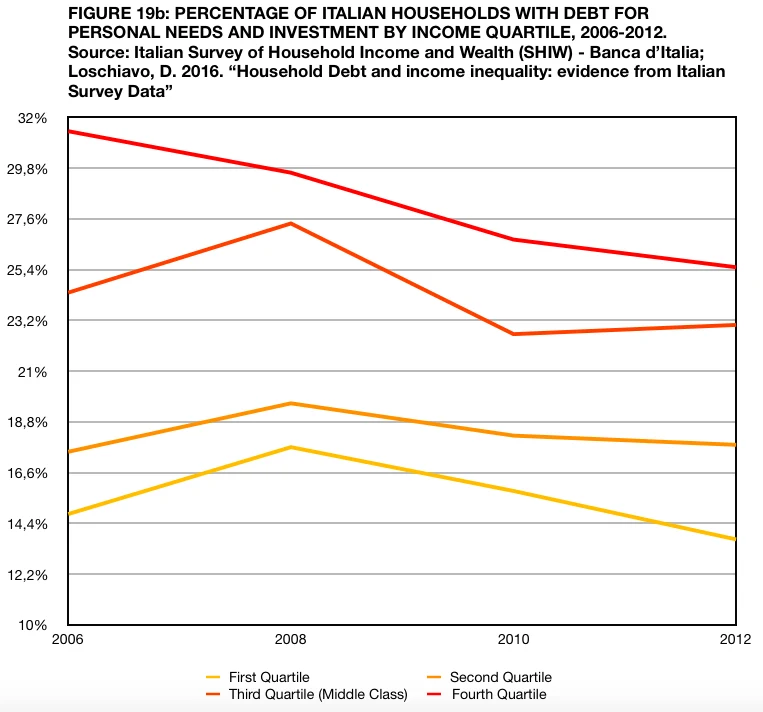
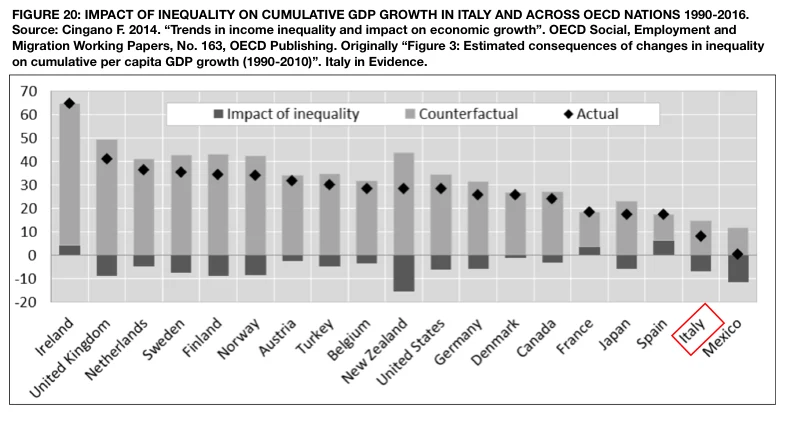
Finally, a third channel substantiating the correlation between increased income inequality and low growth is suboptimal levels of investment in growth-enhancing human capital (Galor and Zeira, 1993). This is due to the negative effect of inequality on the ability of low and middle income households to meet down–payments and return-payments to access credit, as well as to higher inferred debt default risks in presence of credit markets imperfections (Cingano, 2014; Voitchovski, 2005; Loschiavo, 2016). Consistently, evidence indicates that rising income inequality in the middle of the distribution in recent years (2006-2012) combined with tightening credit market conditions – chiefly, partial-coverage loans to value – correlates with a reduction in the share of low and middle income household able to access credit (figure 19a) and actually using credit to finance personal needs and investment (figure 19b) (Liberati and Vacca, 2016; Loschiavo, 2016). In sum, the multi-channel effects of income inequality appear overall responsible for Italy’s shift to a low-grow path between the 1990s and 2010s (figure 20).
3.2 Declining Political Participation
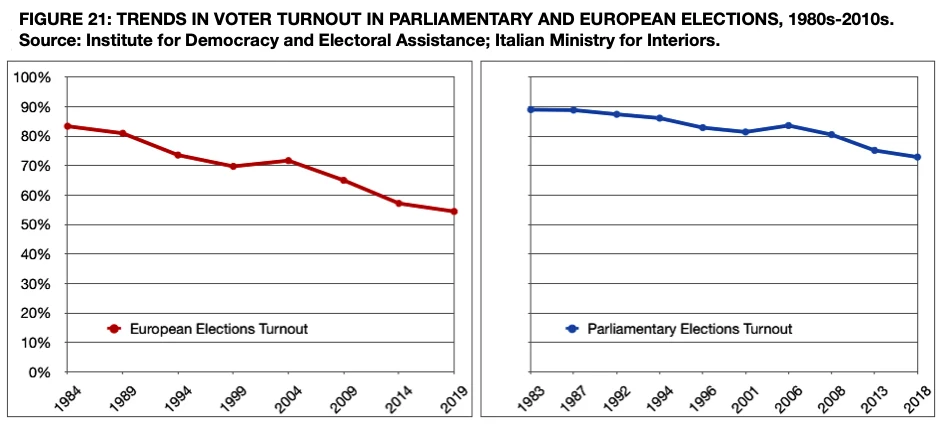
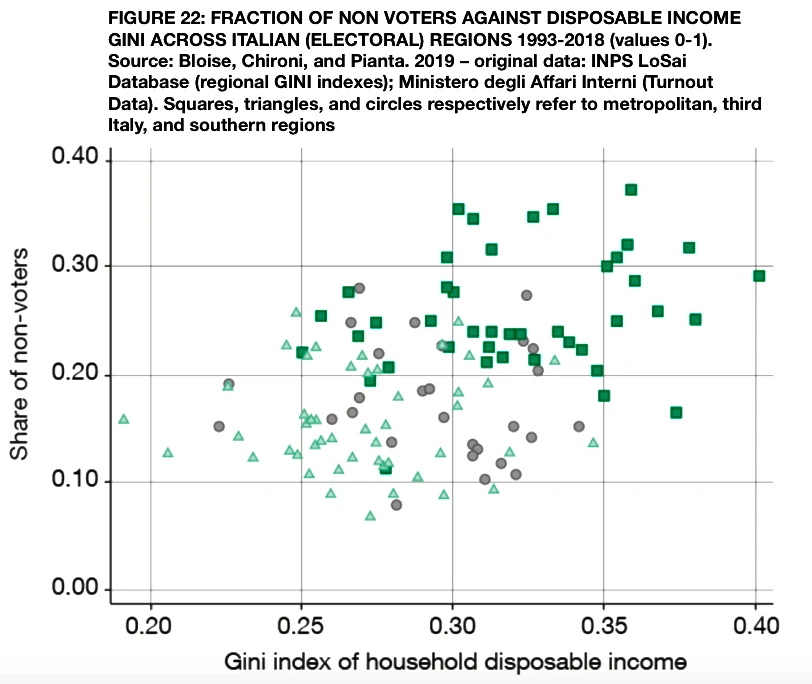
Rising income inequality in Italy also has detrimental consequences on the political selection process. One possible such channel is identified by relative power theory (Solt, 2008). Accordingly, higher income inequality and a squeezing middle class may imply that political power becomes more concentrated at the top of the income distribution (particularly agenda-setting power, cf., Bachrach and Baratz, 1962), with policymaking and agendas increasingly prone to capture by richer individuals. If low and middle income households hold such belief, this may lead to a lower rate of political participation among low and middle income households as opposed to high income ones (Solt, 2008; Piketty, 2018). As shown in figure 21, evidence from electoral statistics for parliamentary and European Elections in Italy supports the case for declining political participation in response to rising income inequality in the middle and and upper half of the distribution over the 1986-2018 period (Ballarino et al., 2014). To complement this, subnational electoral data indicate that the share of non voters across regional electoral districts is positively related to the district’s GINI coefficient (Figure 22; Bloise et al., 2019). Cognately, this provides evidence against the applicability of conflict theory to the Italian case (cf. Solt, 2008).
4. Policy Options
Based on the multiple sources of income inequality identified in section 2, two areas can be highlighted for pre-distributive and redistributive policy intervention: (i) labour market institutions, (ii) education (iii) the tax-and-transfer system (Checchi and van de Wehrforst, 2014; Joumard et al., 2012; Checchi and Garcia-Penalosa, 2008).
4.1 Labour Market Institutions
In the presence of RBTC-induced demand-side changes, strengthening labour market institutions may represent prima facie an efficacious instrument to compress earnings inequality in the middle of the distribution and top half earnings dispersion (Ibid.; Brandolini, 2009; Koeniger et al., 2007). Specifically, as seen in section 2, re-regulating fixed-term contracts by increasing employment protection and prohibiting the use of subsequent fixed-term contracts would strengthen the bargaining position of middle-paid workers both directly and by reducing labour market dualism (Fana et al., 2015; Jappelli and Pistaferri, 2008). While then appealing in principle, full-scale re-regulation may be less expedient in practice and policymakers should proceed with caution. First, an institutional barrier: due to the institutional organisation of Italian economic policy around tripartite concentration (Lijphart, 2012; Rossi, 2007), substantially re-regulating fixed-term employment in the above terms would fall short of the necessary political support by peak employer organisation “Confindustria” in tripartite negotiations (ilSole24Ore, 2018). Second, even though decreasing dualism is not harmful to growth (Koske et al, 2012), reverting labour-market flexibilisation may still be macroeconomically inefficient on other grounds. Labour market flexibilisation has successfully reduced unemployment and informal employment rates, (Pinelli et al., 2017; Tiraboschi, 2005). Further, in the context of a broader shift to flexibility across Europe (Eichhorst et al., 2017), it may also make the Italian labour market comparatively less appealing to international employers.
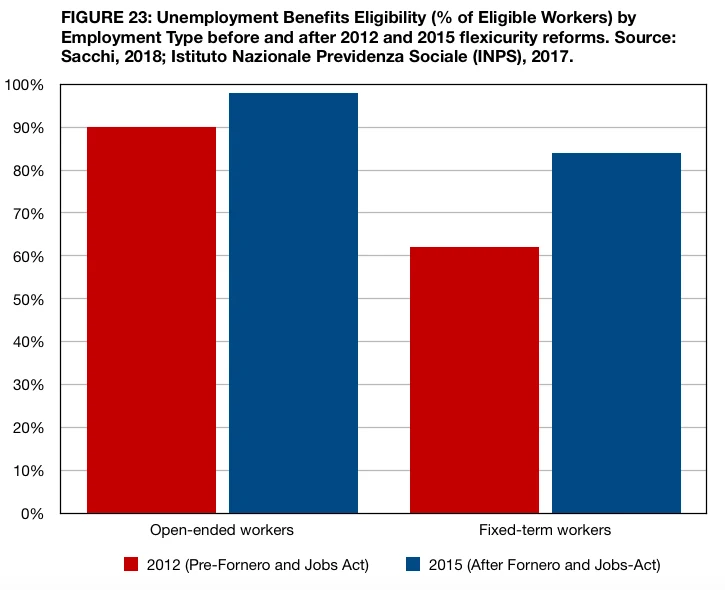
While redistributive in nature and generally less effective in tackling income inequality than strengthening employment protection (Checchi and Garcia Penalosa, 2008), the pursuit of a flexicurity model by augmenting the generosity and coverage of unemployment benefits may then be contingently optimal. As seen in figure 23, the 2012 Fornero reforms and the 2014/15 Jobs Act took steps in this direction, respectively by extending the coverage of unemployment benefits via the introduction of the ASPI and mini-ASPI benefits, and by merging the latter into a more comprehensive and generous scheme (NASPI) (Sacchi, 2014). Yet, access to unemployment security remains suboptimal for the growing number of fixed-term workers, with 16% of fixed term workers lacking an adequate safety net despite increased labour market flexibility (Pinelli et al., 2017). Tackling inequality via flexicurity thus requires expanding the coverage of unemployment benefits among fixed term and especially short term workers – chiefly, by removing the minimum worked-time threshold to access NASPI.
4.2 Education
To tackle income inequality in the middle and top half of the distribution, policies increasing unemployment security are plausibly best complemented by pre-distributive policies to reduce the market incidence of job and wage polarisation in the first place. In the face of RBTC-induced reduction in the occupational opportunities for mid-skill workers, one policy option is to preventively increase education spending to upgrade skills across the distribution in the longer term. This would promote employability in high skill non-routine jobs and knowledge intensive industries rather than in middle-skill routinisable jobs, and thus contribute to compressing earnings dispersion in the top half of the distribution (Esposito, 2020; OECD, 2019; Checchi and van de Wehrforst, 2014).
In these terms, the targeting of educational spending is especially important in the Italian context to avoid a neutral result relative to skill and wage inequality. Quantitative analyses from recent literature indicate that a significant driver of individual educational attainment in Italy is the parent’s level of education – comparatively, Italy has one of the highest intergenerational elasticities in terms of educational attainment (Cannari e D’Alessio, 2018; Checchi et al., 2013). To optimise the impact of increased spending on education on skill upgrading across the distribution, it is thus necessary to target spending on primary and secondary education to weaken intergenerational correlation in educational attainment (Ballarino et al., 2014; cf. Heckman et al., 2013; Culclough, 1982). (Provided spending is geographically well distributed) such a policy would plausibly encounter little political resistance as access to primary and secondary education in Italy is typically non-excludable. Further, increasing spending on education and consequent skills upgrading is conducive to growth, yielding a ‘double-dividend’ outcome (Joumard et al., 2012), and might spread the costs of debt-financed increased unemployment security in the longer term by reducing the incidence of unemployment and increasing returns in the economy.
4.3 The Tax-and-Transfer System
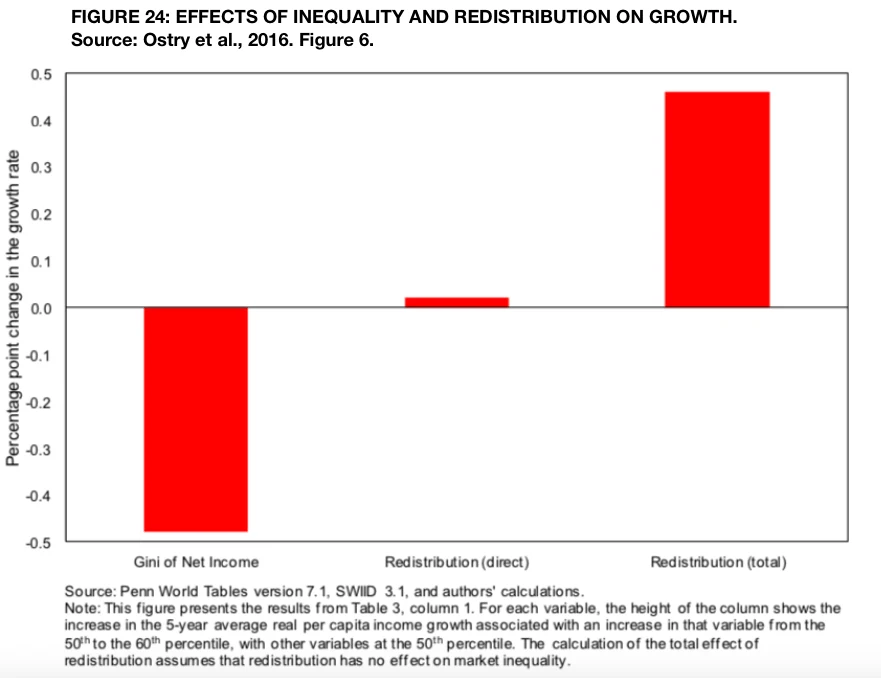
While both appear necessary to reduce income inequality and middle-class squeezing in the context of RBTC and irreversible labour market flexibilisation, the single most significant barrier to increasing flexicurity coverage and spending on education is their cost relative to the capability of Italian public finances. Even though they may constitute good debt by reducing income inequality, the 155.7% Debt/GDP ratio and the European Excessive Deficit Procedure limits their feasibility. As such, a review of the Italian tax-and-transfer system may be essential to achieve equitable growth and financial sustainability in the future. Recalling section 2.3, reviewing the public social expenditure profile is also independently motivated by the fact its low progressivity is conducive to high disposable income inequality (Brandolini, 2009). Redistributing social public expenditure from contributions-based and “actuarially neutral” pensions to progressive benefits such as family expenditures, primary and secondary education spending, and high coverage unemployment benefits may thus help lower both disposable income inequality and finance the flexicurity and educational interventions assessed above. It should though be noted that reducing expenditure on pensions has historically met political resistance due to the (increasing) share of pensioners in the electorate capable of exerting electoral retribution (Andrle et al., 2021). This implies that a fundamental tradeoff may subsist in Italy between political support and tackling income inequality in a financially sustainable fashion. Alternatively, an increase in top income tax rates (IRPEF) to bring them from the current 43% level to the revenue-maximising 57 83% band may increase the capability to meet to finance flexicurity and education spending sustainably and control the observed (moderate) rise in Italian top incomes (Piketty et al., 2014; Hope and Limberg, 2020). While literature suggest that a hike direct redistribution may adversely affect economic growth (Alesina and Rodrik, 1994), this may be offset by the positive impact on growth achieved through the overall reduction in income inequality (Hope and Limberg, 2020; Ostry et al., 2014, cf. fig 24).
5. Policy Recommendations
Thus, policy recommendations can be summarised as follows:
- Policymakers should be cautious in re-regulating fixed term employment, and rather focus on improving flexicurity by extending the coverage of fixed-term NASPI benefits.
- Spending on education should be increased, and targeted to primary and secondary education to optimise its impact on skill-upgrading.
- Increasing top IRPEF rates and redistributing public expenditure from contributions-based pensions to points 1-2 is necessary to ensure intervention against market inequality is financially sustainable, and to abate the high level of disposable income inequality.
Bibliography
- Acemoglu, D., Autor, D. (2011). Skills, tasks, and technologies: Implications for employment and earnings. Handbook of Labor Economics. Vol 4, pp. 1043-1171. Elsevier.
- Acemoglu, D. (2003). Cross-country inequality trends. The Economic Journal, 113(485), F121- F149.
- Alvaredo, F., Atkinson, A. B., Piketty, T., Saez, E. (2013). The top 1 percent in international and historical perspective. Journal of Economic Perspectives, 27(3), pp. 3-20.
- Alvaredo, F., and E. Pisano (2010). “Top Incomes in Italy 1974-2004”, in A.B. Atkinson and T. Piketty (eds.), Top Incomes: A Global Perspective. Oxford: Oxford University Press, 625-663.
- Alesina, A., Rodrik, D. (1994). Distributive Politics and Economic Growth. The Quarterly Journal of Economics, 109(2), 465-490.
- Anastasia, B. (2012). “Sulla ‘Trappola della Precarietà’: Quali Indicazioni dalle Ricerche Empiriche e dalle Statistiche Disponibili?” in Dell’Aringa C. and T. Treu, Editor(s), Giovani senza Futuro? Proposte per una Nuova Politica, Arel-Il Mulino: Bologna.
- Andrews, D., Jencks, C., Leigh, A. (2011). Do rising top incomes lift all boats? The BE Journal of Economic Analysis Policy, 11(1).
- Andrle, M., Hebous, S., Kangur, A. (2021). Italy: toward a growth-friendly fiscal reform. Economia Politica 38, 385–420.
- Armingeon, K., Baccaro, L. Political Economy of the Sovereign Debt Crisis: The Limits of Internal Devaluation, Industrial Law Journal, Volume 41, Issue 3, September 2012, Pages 254–275.
- Atkinson, A. B. (2003). Income inequality in OECD countries: Data and explanations. CESifo Economic Studies, 49(4), 479-513.
- Atkinson, A.B., L. Rainwater and T. M. Smeeding (1995), Income Distribution in OECD Countries, OECD Social Policy Studies, No. 18, Paris.
- Autor, D., and Dorn, D. 2013. “The Growth of Low-Skill Service Jobs and the Polarization of the US Labor Market.” The American Economic Review 103, no. 5 American Economic Association: 1553–97.
- Autor, D., Katz, L., Kearney, M. Kearney. (2006). “The Polarization of the U.S. Labor Market.” American Economic Review 92, no. 2: 189–94.
- Baccaro, L., Howell, C. (2011). “A Common Neoliberal Trajectory: The Transformation of Industrial Relations in Advanced Capitalism.” Politics Society 39, no. 4: 521–63.
- Ballarino, G., M. Braga, M. Bratti, D. Checchi, A. Filippin, C. Fiorio, M.
- Leonardi, E. Meschi and F. Scervini. (2014). “Italy: How Labour Market Policies Can Foster Earnings Inequality”, in B. Nolan, W. Salverda, D.Checchi, I. Marx, A. McKnight, I.G. Tóth and H.G. van de Werfhorst (eds.), Changing Inequalities and Societal Impacts in Rich Countries: Thirty Countries’ Experiences. Oxford: Oxford University Press, 369-392.
- Banerjee, A.V., Duflo, E. (2003) Inequality and Growth: What Can the Data Say?. Journal of Economic Growth 8, 267–299.
- Basso, G. (2019). The Evolution of the Occupational Structure in Italy in the Last Decade. Questioni di Economia e Finanza (Occasional Papers) No. 478, febbraio 2012. Banca d’Italia - Eurosistema.
- Bloise, F., Chironi, D., Pianta, M. (2019). ”Inequality and elections in Italian regions,” MPRA Paper 96416, University Library of Munich, Germany.
- Boeri, T. (2011). “Institutional Reforms and Dualism in European Labor Markets”, in Ashenfelter, O. and D. Card, Editor(s), Handbook of Labor Economics, Volume 4B, North Holland: Amsterdam and New York.
- Bourguignon, F. (1981). Pareto Superiority of Unegalitarian Equilibria in Stiglitz’ Model of Wealth Distribution with Convex Saving Function. Econometrica, 49(6), 1469-1475.
- Brandolini, A., Gambacorta R., Rosolia, A. 2018. ”Inequality amid income stagnation: Italy over the last quarter of a century,” Questioni di Economia e Finanza (Occasional Papers) 442, Bank of Italy, Economic Research and International Relations Area.
- Brandolini, A. (2009). “Income Inequality in Italy: Facts and Measurement”. In Società Italiana di Statistica (ed.), Proceedings of the XLIV Scientific Meeting. Università della Calabria, June 25-27, 2008, pp. 55- 77. Padua: CLEUP, 2008.
- Brandolini, A., Smeeding, T. M. (2006). Patterns of economic inequality in western democracies: some facts on levels and trends. PS: Political Science Politics, 39(1), 21-26.
- Brandolini, A. (1999). “The Distribution of Personal Income in Post-War Italy: Source Description, Data Quality, and the Time Pattern of Income Inequality. Giornale degli Economisti e Annali di Economia, 58: 183-239
- Burniaux, J-M, T-T Dang, D. Fore, M.F. Förster, M. Mira d’Ercole and H. Oxley. (1998), “Income Distribution and Poverty in Selected OECD Countries”, OECD Economics Department Working Paper, No. 189,. Paris.
- Campiglio, L.P. (2013). ”Why Italy’s saving rate became (so) low?,” DISCE - Quaderni del Dipartimento di Politica Economica, Università Cattolica del Sacro Cuore, Dipartimenti e Istituti di Scienze Economiche (DISCE).
- Cannari, L., D’Alessio, G. (2018) Education, Income and Wealth: Persistence Across Generations in Italy. Questioni di Economia e Finanza, n. 476, Bank of Italy
- Cappellari, L., C. Dell’Aringa and M. Leonardi (2011), “Temporary Employment, Job Flows and Productivity: A Tale of two Reforms”, CESifo Working Paper no. 3520.
- Checchi, D., van de Werfhorst, H. (2014). ”Educational Policies and Income Inequality,” IZA Discussion Papers 8222, Institute of Labor Economics (IZA).
- Checchi D., Fiorio C., Leonardi M. (2013), ”Intergenerational persistence of educational attainment in Italy,” Economics Letters, vol. 118(1), pages 229- 232.
- Checchi, D., Garcıa-Penalosa, C. (2008). Labour market institutions and income inequality. Economic Policy, 23(56), 602-649.
- Cingano, F. (2014). Trends in Income Inequality and its Impact on Economic Growth. OECD Social, Employment and Migration Working Papers, No. 163. OECD Publishing, Paris. CNEL.“Rapporto sul Mercato del Lavoro”, CNEL: Rome. Series 2016, 2015, 2014, 2013, 2012, 2011, 2010, 2009.
- Colclough, C., (1982). ”The impact of primary schooling on economic development: a review of the evidence,” World Development, Elsevier, vol. 10(3), pages 167-185.
- Eichhorst, W., Marx, P. Wehner, C. (2017). Labor market reforms in Europe: towards more flexicure labor markets?. J Labour Market Res 51, 3.
- Esposito, P. Scicchitano, S. 2020. ”Educational mismatches, technological change and unemployment: evidence from secondary and tertiary educated workers,” GLO Discussion Paper Series 465, Global Labor Organization (GLO).
- Fana, M., Guarascio, D., Cirillo, V. (2015). ”Labour market reforms in Italy: evaluating the effects of the Jobs Act,” LEM Papers Series 2015/31, Laboratory of Economics and Management (LEM), Sant’Anna School of Advanced Studies, Pisa, Italy.
- Franco, D. (2002). ”Italy: A Never-Ending Pension Reform,” NBER Chapters, in: Social Security Pension Reform in Europe, pages 211-262, National Bureau of Economic Research, Inc.
- Galor, O., Zeira, J. (1993), “Income Distribution and Macroeconomics”. Review of Economic Studies, 60, issue 1, p. 35-52.
- Galor, O., Tsiddon, D. (1996). ”The Distribution of Human Capital and Economic Growth,” Working Papers 1996-32, Brown University, Department of Economics.
- Goos, M.; Manning, A., Salomons, A. (2014). ”Explaining Job Polarization: Routine-Biased Technological Change and Offshoring.” American Economic Review, 104 (8): 2509-26.
- Goos, M., Manning, A., Salomons, A. (2009). Job Polarization in Europe. The American Economic Review, 99(2), 58-63.
- Goos, M., Manning, A. (2007), Lousy and Lovely Jobs: The Rising Polarization of Work in Britain, The Review of Economics and Statistics, 89, issue 1, p. 118-133.
- Guarascio, F. Sacchi, S. (2017) Digitalizzazione, automazione e futuro del lavoro, INAPP, Rome.
- Heckman, J. J., Pinto R., Savelyev, P.A. (2013). Understanding the mechanisms through which an influential early childhood program boosted adult outcomes. American Economic Review 103(6), 2052–2086.
- Hope, D., Limberg, J. (2020). ”The economic consequences of major tax cuts for the rich,” LSE Research Online Documents on Economics 107919, London School of Economics and Political Science, LSE Library.
- Hope, D., Martelli, A. (2019). The transition to the knowledge economy, labour market institutions, and income inequality in advanced democracies. World Politics, 71(2).
- Iyke, N.B., Ho, SY. (2017). ”Income Inequality and Growth: New Insights from Italy,” MPRA Paper 78268, University Library of Munich, Germany.
- ilSole24Ore. 2018. ”Decreto lavoro, Confindustria: no a retromarce sulle riforme avviate. Di Maio: “Fate terrorismo psicologico , article by V. Nuti Available at https://www.ilsole24ore.com
- Jappelli, T., Pistaferri, L. (2009). “Does Consumption Inequality Track Income Inequality in Italy?”. Review of Economic Dynamics.
- Joumard, I., Pisu, M., Bloch, D. (2012). ”Tackling income inequality: The role of taxes and transfers,” OECD Journal: Economic Studies, OECD Publishing, vol. 2012(1), pages 37-70.
- Kazepov, Y. (2015). Italian social assistance in the European context: residual innovation and uncertain futures. In The Italian Welfare State in a European Perspective: A comparative analysis, ed. Ascoli, U., Pavolini, E. Bristol: Bristol University Press, Policy Press. pp. 101-32.
- Koeniger, W., Leonardi, M., Nunziata, L. (2007). Labor market institutions and wage inequality. ILR Review, 60(3), 340-356.
- Lakner, C., Milanovic, B. (2016). Global Income Distribution: From the Fall of the Berlin Wall to the Great Recession, World Bank Economic Review, 30, issue 2, p. 203-232.
- Lasinio, C., Vallanti, G. (2013). Reforms, Labour Market Functioning and Productivity Dynamics: A Sectoral Analysis for Italy. Government of the Italian Republic (Italy), Ministry of Economy and Finance, Department of the Treasury Working Paper No. 10.
- Lijphart, A. (2012). Patterns of Democracy. Yale University Press.
- Loschiavo, D. (2016). ”Household debt and income inequality: evidence from Italian survey data,” Temi di discussione (Economic working papers) 1095, Bank of Italy, Economic Research and International Relations Area.
- Massari, R., M. G. Pittau and R. Zelli (2009). “A Dwindling Middle Class? Italian Evidence in the 2000s”. Journal of Economic Inequality 7(4), 333- 350.
- Nordhaus, W. D. (2007). “Two Centuries of Productivity Growth in Computing.” The Journal of Economic History 67, no. 1: 128–59.
- OECD. (2019), Under Pressure: The Squeezed Middle Class, OECD Publishing, Paris.
- Ostry, J.D, Berg, A., Tsangarides, C.G. (2014), “Redistribution, Inequality, and Growth”, IMF Staff Discussion Note 14/02.
- Koske, I., Fournier, J., Wanner I. (2012) ”Less Income Inequality and More Growth – Are They Compatible? Part 2. The Distribution of Labour Income”, OECD Economics Department Working Papers, No. 925, OECD Publishing, Paris.
- Oliveri, E. (2012). “Il cambiamento delle opportunità lavorative”. Questioni di Economia e Finanza (Occasional Papers) No. 117, febbraio 2012. Banca d’Italia - Eurosistema.
- Persson, T., Tabellini, G. (1994). Is inequality harmful for growth? American Economic Review, 600-621.
- Picot, G., Tassinari, A. 2017. “All of One Kind? Labour Market Reforms under Austerity in Italy and Spain.” Nuffield College Oxford Working Papers; Socio-Economic Review, vol 15(2): 461-82. Oxford: Oxford University Press.
- Piketty, T., Saez, E. (2014). Inequality in the long run. Science, 344(6186), 838-843.
- Pinelli, D. István, P., János V., (2016). ”Exploring Italy’s Growth Challenge A Model-Based Exercise,” European Economy - Discussion Papers 2015 - 041, Directorate General Economic and Financial Affairs (DG ECFIN), European Commission.
- Pontusson, J., Rueda, D., Way, C. R. (2002). Comparative political economy of wage distribution: The role of partisanship and labour market institutions.British Journal of Political Science, 32(2), 281-308.
- Roine, J., Vlachos, J., Waldenström, D. (2009). The long-run determinants of inequality: What can we learn from top income data? Journal of Public Economics, 93(7-8), 974-988.
- Rossi, S. (2007). La politica economica italiana 1968-2007. Roma e Bari: Laterza. Sacchi, S. 2018. “The Italian Welfare State in Crisis: Learning to Adjust?”. South European Society and Politics. Vol 23(1) “Italy Transformed”: 29-46.
- Sacchi, S. (2018) The Italian Welfare State in the Crisis: Learning to Adjust?, South European Society and Politics, 23:1, 29-46
- Sacchi, S., Vesan, P. (2015). “Employment Policy: segmentation, deregulation and reform in the Italian labour market”. In The Italian Welfare State in a European Perspective: A comparative analysis, ed. Ascoli, U., Pavolini, E. Bristol: Bristol University Press, Policy Press. pp. 71-100.
- Solt, F. (2008). Economic Inequality and Democratic Political Engagement. American Journal of Political Science, 52(1), 48-60.
- Tiraboschi, M. (2005). “The Italian Labour Market after the Biagi Reform”. International Journal of Comparative Labour Law and Industrial Relations 21(2), pp. 149-192.
- Vacca, V., Liberati, D. (2016). ”With (more than) a little help from my bank. Loan-to-value ratios and access to mortgages in Italy,” Questioni di Economia e Finanza (Occasional Papers) 315, Bank of Italy, Economic Research and International Relations Area.
- Van Reenen, J. (2011). Wage inequality, technology and trade: 21st century evidence. Labour Economics, 18(6), 730-741.
- Vecchi, Giovanni, (2011), The Well-Being of Italians: A Comparative Historical Approach, No 19, Quaderni di storia economica (Economic History Working Papers), Bank of Italy, Economic Research and International Relations Area
- Voitchovsky, S. (2011). Inequality and Economic Growth. In Brian Nolan, Wiemer Salverda, and Timothy M. Smeeding (Eds.). The Oxford Handbook of Economic Inequality. Oxford: Oxford University Press.
- Banca d’Italia - Bank of Italy. (2012). Survey on Household Income and Wealth (SWIH). Data on Personal Debt by income quartile extracted and reelaborated by Loschiavo, D. (2016). (see relevant bibliographic entry); Data on Loans-to-value access by income quartile extracted and re-elaborated by Vacca, V., Liberati, D. (2016) (see relevant bibliographic entry). Consiglio Nazionale Economia e Lavoro (CNEL). (2016). Rapporto sul mercato del lavoro. Vouchers sold in Italy 2009-2015. EU KLEMS Growth and Productivity Accounts: November 2009 Release, updated March 2011; WORLD KLEMS Growth and Productivity Accounts.
- Goos, M.; Manning, A., Salomons, A. (2014). Cross-country data 1993- 2010: change in hours worked by ISCO code, Italy – re-elaboration of European Labour Force Survey Data. In “Explaining Job Polarization: Routine- Biased Technological Change and Offshoring.”
- International Institute for Democracy and Electoral Assistance - IDEA. (2021). Voter Turnout Database, Italy 1980-2018. https://doi.org/10.31752/idea.2018.69
- Istituto Nazionale Previdenza Sociale (INPS). (2017) ‘XVI Rapporto Annuale’, available online at: www.inps.it/NuovoportaleINPS. Data on unemployment eligibility by employment type extracted and re-elabrated by Sacchi, S. (2018) (see relevant biblographic entry).
- Luxembourg Income Study. (2021). LIS Data Access Research Tool (DART), https://dart.lisdatacenter.org/. Luxembourg. [Accessed 10.04.2021]
- OECD. (2021). OECD Earnings Database. Interdecile Ratios of Gross Earnings (Italy, 2000-2018). Available at https://stats.oecd.org/Index.aspx?Data SetCode=DECI. [Accessed 10.04.2021]
- OECD. (2021). OECD Labour Force Statistics. Strictness of Employment Protection (Italy). [Accessed 10.04.2021].
- OECD. (2021). OECD Labour Force Statistics. Share of permanent employment 2000-2018 (Italy). [Accessed 10.04.2021].
- OECD. (2021). Social Expenditure and Well-Being Database (SOCX). [Accessed 10.04.2021].
- OECD (2004), OECD Employment Outlook 2004, OECD Publishing, Paris. Country table, Italy time series 1985-2000. 5 year annual averages.
- OECD (1996), OECD Employment Outlook 1996, OECD Publishing, Paris. Country table, Italy time series 1985-1995. 5 year annual averages.
- Solt, F. (2016). ”The Standardized World Income Inequality Database.” Social Science Quarterly 97(5):1267-1281; SWIID Version 9.0, October 2020.
- World Bank. (2021). World Development Indicators: % Gross Saving Rates, Italy 1986-2018. [Accessed 11.04.2021]
- World Bank. (2021). World Development Indicators: GDP growth annual (%), Italy 1986-2018. [Accessed 11.04.2021]
- World Bank. (2021). World Development Indicators: Final Household and NPISHs expenditure annual growth rate (%), Italy 1986-2018. [Accessed 11.04.2021]
- World Inequality Database. (2021). Pre-Tax Income Share - Top 1% Share (Selection: Italy, 1986-2018). Available at https://wid.world/data/. [Accessed 10.04.2021]
Citar
Biagio Rosso, "Income inequality in Italy: policy analysis", Génération Maastricht, 28 July 2021, https://generationmaastricht.org/research/income-inequality-in-italy-policy-analysis.